4
Trial version
Graph Paper Printer
Create and print a variety of graph paper
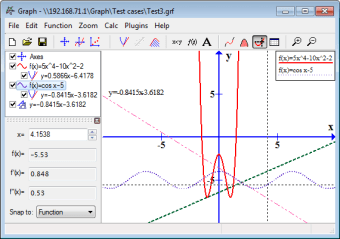
Graph is an open source application used to draw mathematical graphs in a coordinate system. Anyone who wants to draw graphs of functions will find this program useful.
The program makes it very easy to visualize a function and paste it into another program. It is also possible to do some mathematical calculations on the functions.
g. sin, cos, log, etc. You may specify color, width and line style of the graphs, and the graphs may me limited to an interval. It is also possible to show a circle at the ends indicating open or closed interval.
You may also copy the coordinate system into another program, e. g. Microsoft Word, either as a normal image or as an OLE object, which may be edited later by double clicking on it.
The axes, which may by normal or logarithmic, can be placed either by entering specific values, or by moving or zooming with the mouse.
Alternatively the function may be traced with the mouse. Graph can also fill a table with evaluated function coordinates in a user specified range.
Data from the table can easily be copied into another program, e. g. Excel.
The program can also show the first derivative of a function, and create tangents and normal lines to a function at given coordinates.
Data for a point series can be imported from other programs, e. g. Microsoft Excel. It is possible to create a line of best fit from the data in a point series, either from one of the built-in models or from a user specified model.
In addition to the optional legend used to describe each function, a label may be added anywhere in the system. A label can contain text with different fonts, images and objects created in other programs.
Create and print a variety of graph paper

Tool for making and analyzing graphs
Draw and analyze mathematical functions
Free
Windows
Other platforms (1)Windows NT
English
104.9K
10.07 MB
Have you tried Graph? Be the first to leave your opinion!
Add reviewTrial version
Create and print a variety of graph paper
Trial version
Design and print your own calendar easily
Free
A Free Science & education program for Windows
Free
MindLine Mind Map
Trial version
Convert Kindle’s AZ files into PDF files
Create and print a variety of graph paper
Tool for making and analyzing graphs
Draw and analyze mathematical functions
Plot and animate 2D and 3D equation and table-based graphs with ease
SigmaPlot: Advanced Data Visualization Tool
Comprehensive Charting Tool for Windows
Flexible and free mathematical software
A free image curve extract tool that is simple and easy to use
Comprehensive PCB Design Software for Windows
An interactive chemistry lab simulation for Windows
The software can render from 1 up to 12 dice on your screen, each one displaying numbers from 1 to 9
Explore the Universe with Stellarium Portable
REMOVE DRM FROM YOUR HARD-BOUGHT EBOOKS.
Kidspiration Educational Tool Review
El Flautista de Hamelin Overview
Graphing Calculator Toolbar Overview
Calq - Free Science Software for Windows
HelpSmith: Structured Help File Editor
MCM Alchimia Overview
Desktop Dolphin Coloring Book